
Ensuring the safety and consistency of AAV-based therapies and other biotherapeutic modalities begins with reliable, high-resolution analytical testing. At BioAnalysis, we deliver the confidence developers need with our CE platform, powered by the SCIEX PA800 Plus, to precisely quantify VP ratios, genome integrity, and detect impurities with clarity and reproducibility. This technology includes the Laser-Induced Fluorescence (LIF) detector for increased sensitivity. We also use the PA800 Plus to perform capillary isoelectric focusing (cIEF) to assess charge heterogeneity of biotherapeutics such as monoclonal antibodies.
cGMP Compliant | 21 CFR Part 11 | FDA/EMA Ready
Which CE method does your program need?
| Method | Separates by | What it measures |
|---|---|---|
| CE-SDS (LIF) | Protein and nucleic acid size | VP1:VP2:VP3 ratio, protein purity, fragments, reduced and non-reduced profiles, AAV genome integrity, plasmid topology |
| cIEF | Isoelectric point | Charge variants, apparent pI |
Why CE-SDS for AAV Characterization?
Capillary electrophoresis-SDS (CE-SDS) provides a high-performance alternative to traditional SDS-PAGE. By denaturing proteins with SDS and separating them based on size under an applied voltage, CE-SDS generates highly resolved, quantitative profiles of each capsid protein. With laser-induced fluorescence (LIF) detection, the system offers enhanced sensitivity and precision, helping teams accelerate decision-making and strengthening their product quality strategy.
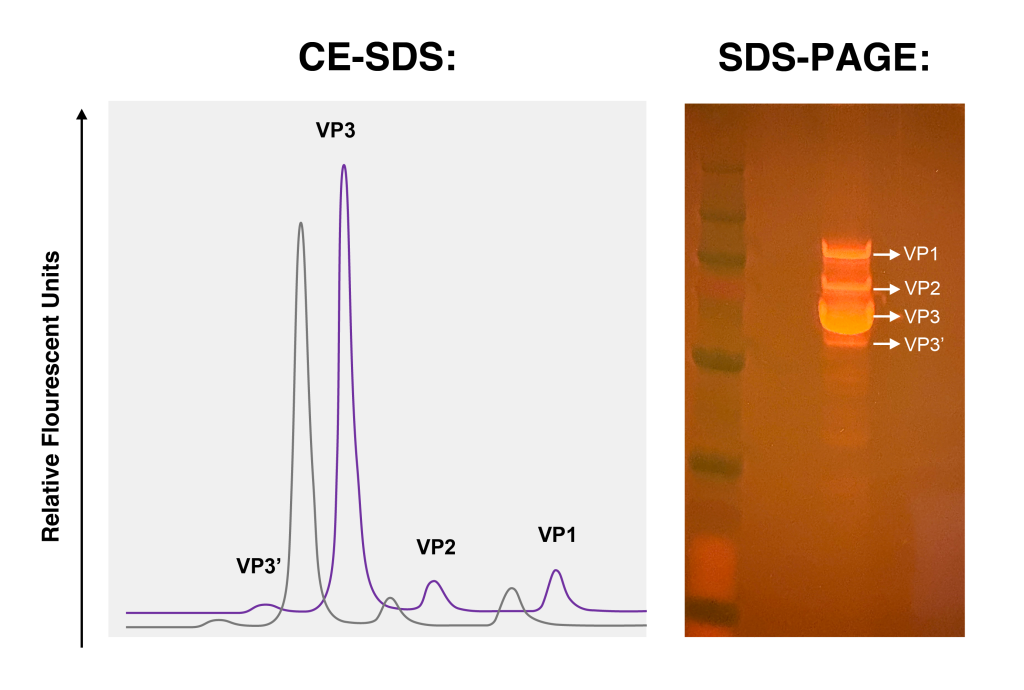
Critical quality attributes supported by CE
| Measurement | Method | CQA category |
|---|---|---|
| VP1:VP2:VP3 ratio | CE-SDS (LIF) | Capsid protein integrity, Purity |
| Capsid and protein purity | CE-SDS (LIF) | Purity |
| Fragments and clipped species | CE-SDS (LIF) | Purity, stability-indicating |
| AAV genome integrity | CE-SDS (LIF) | Purity |
| Plasmid topology | CE-SDS (LIF) | Starting material control |
| Charge variant profile | cIEF | Stability and product heterogeneity |
| Apparent pI | cIEF | Identity and product heterogeneity |
VP1:VP2:VP3 ratio by CE-SDS
AAV capsids assemble from three viral proteins, VP1, VP2, and VP3. CE-SDS denatures the capsid, coats each protein with SDS, separates the proteins by molecular size, and quantifies each VP as a proportion of total capsid protein. Laser-induced fluorescence detection provides the sensitivity needed at the low protein concentrations typical of AAV drug substance.
The VP ratio is a critical quality attribute because VP1 carries the phospholipase A2 domain required for endosomal escape after cell entry. VP1 content therefore correlates with transduction efficiency, which may impact potency in addition to providing an identity measurement.
Genome integrity by CE-SDS (LIF)
After capsid disruption and genome release, the DNA is stained with fluorescent nucleic acid dye and separated by size using capillary gel electrophoresis with laser-induced fluorescence detection. The method resolves full-length genomes from truncated and partial species, enabling quantification of the percentage of full-length genomes.
Genome integrity complements empty, partial, and full capsid analysis by sedimentation velocity analytical ultracentrifugation (SV-AUC). The sedimentation coefficient of a capsid correlates to the amount of packaged DNA, while CE-LIF assesses whether the DNA exists as an intact molecule.
Plasmid topology by CE-SDS (LIF)
Quantitation of supercoiled, open circular, and linear forms in transfection plasmid starting material, supporting incoming material control for viral vector manufacturing.
The BioAnalysis Advantage
- Superior resolution and quantitation to confidently determine VP1:VP2:VP3 ratios
- Outstanding reproducibility for consistent results across studies and batches
- Rapid turnaround times to keep development timelines moving
- Clear identification of impurities to support product safety and regulatory readiness
- Precisely monitor charge variants, such as those attributable to C-terminal lysine truncation, that arise during manufacturing and can have detrimental effects on drug product activity
How the Assay Works

CE-SDS for VP Ratio
- Sample proteins are reduced, denatured, and uniformly coated with SDS
- Fluorogenic labeling enhances detection sensitivity (label-free UV detection methods may also be used)
- SDS-protein complexes (VP3, VP2, VP1) are cleanly separated according to relative molecular mass under an applied electric field
- Each species is detected and quantified

CE-SDS (LIF) for genome integrity
- Unpackaged DNA is enzymatically digested so that only encapsidated genome is analyzed
- Capsids are disrupted and the vector genome is released
- DNA is labeled with a fluorescent dye
- Genome species are separated by size in a sieving gel matrix
- Full-length and truncated species are quantified by LIF detection

cIEF for charge variants
- The sample is mixed with carrier ampholytes, pI markers, and stabilizing additives, prior to being loaded into the capillary
- High voltage establishes a pH gradient along the capillary. Each protein species in the sample migrates through the gradient until it reaches the pH corresponding to its isoelectric point (pI), where its net charge and electrophoretic mobility approach zero, causing it to focus at that position.
- Focused protein species are mobilized past the detector while maintaining their separation according to pI
- Protein species are detected by UV absorbance at 280 nm
- Apparent pI values are calculated using the internal pI markers, and charge variants are quantified as acidic, main, and basic peak percentages
Available as both a research-use assay and a cGMP-compliant, regulation-ready method, our CE-SDS (LIF) and cIEF offering supports programs from early discovery through late-stage development.
Why Choose BioAnalysis?

1. Scientific Excellence
Our team delivers rigorous methods and clear results.

2. Client Partnership
We work closely with your team, providing collaborative solutions tailored to your unique challenges.

3. Rapid Delivery
Efficient workflows and optimized processes ensure timely results without compromising scientific rigor.

4. Proven Track Record
Supporting numerous IND, BLA, and MAA applications with successful FDA/sponsor audits.
Breaking Through
Breaking through scientific barriers starts with breakthrough research. Explore how our published expertise delivers proven solutions for clients like you.
View all publications: bioanalysisllc.com/technical-hub
Ready to get started? Contact our team to discuss your CE-SDS testing needs.
Frequently asked questions
How is the AAV VP1:VP2:VP3 ratio measured?
The VP1:VP2:VP3 ratio is measured by CE-SDS, which separates the three denatured, SDS-coated capsid proteins by molecular size and quantifies each as a proportion of total capsid protein. Laser-induced fluorescence detection is used for added sensitivity on limited sample amounts.
How is AAV genome integrity measured?
AAV genome integrity is measured by CE with laser-induced fluorescence detection (CE-LIF), which resolves full-length genomes from truncated and partial species. After the capsid is disrupted, the extracted DNA is stained with fluorescent dye and separated by size. LIF detection provides the sensitivity needed for the small DNA quantities recovered from AAV preparations.
What is the difference between CE-SDS and SDS-PAGE?
CE-SDS separates SDS-coated proteins in a capillary with automated detection, producing quantitative electropherograms; SDS-PAGE separates them in a gel matrix analyzed by staining and densitometry. Both techniques separate proteins by size, but CE-SDS offers better resolution, reproducibility, and quantitation, making CE-SDS the preferred method for release and stability testing.
What does cIEF measure?
Capillary isoelectric focusing (cIEF) separates proteins according to their isoelectric point (pI), providing both the charge-variant profile and the apparent pI of individual species. Charge variants can arise from modifications such as deamidation and sialylation, which generally shift pI toward more acidic values, and incomplete C-terminal lysine clipping, which can produce more basic species. Comparison of apparent pI and the charge-variant profile with a qualified reference standard can support product identity and stability assessment.